How To Add a GIF to Google Slides
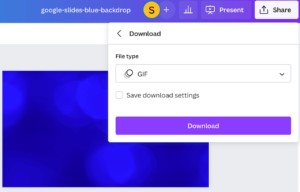
Adding a GIF file to one or more slides can spruce up your Google Slides presentation. There are three ways to add a GIF (Graphics Interchange Format) file to Google Slides. Add a GIF on … Read more →
A collection of blog posts about how to use Google Slides, either with a consumer Gmail account or with a business Google Workspace account.
Adding a GIF file to one or more slides can spruce up your Google Slides presentation. There are three ways to add a GIF (Graphics Interchange Format) file to Google Slides. Add a GIF on … Read more →

Update: In November 2023, Google announced a native video slide narration capability. The process below can still be used if you need video editing capabilities. There are times you may want to record a voiceover … Read more →
Google Slides is presentation software that’s part of Google Workspace and consumer Gmail. Any presentation can be enhanced by adding audio. In this post, we’ll explain how to insert audio files, including background music clips, … Read more →
There are several reasons you may want to change your Google Slides from the default horizontal 16:9 aspect ratio into a vertical format. You want to use Google Slides to design a PDF brochure You’d … Read more →
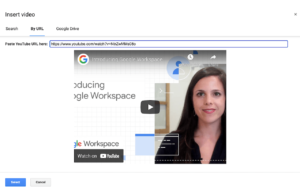
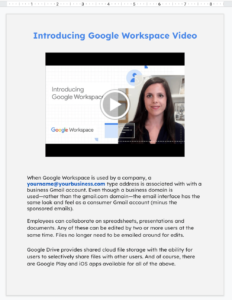
There are two types of videos that can be embedded in Google Slides and then played back within a slide in Slideshow mode. The first type is a YouTube video. The second is a video … Read more →
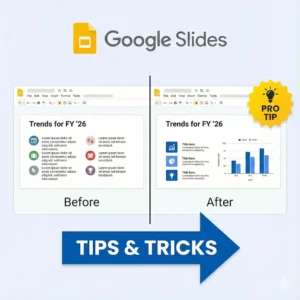
Google Slides lets you collaborate with others in your organization to create business presentations. With Google’s continuous delivery of new features and functionality, there are always new ways to make your presentations more effective. Here … Read more →

A better way than emailing slide decks around. Google Slides allows multiple people to collaborate in real-time on an online presentation.
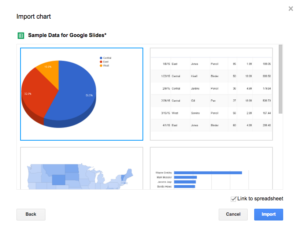
Google Workspace users can present live data in Google Slides. This can be an embedded Google Sheets chart or third party app data.
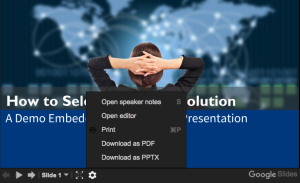
Any Google Slides presentation can be published and embedded on a website. By getting a little creative with your slide shows and embed codes, you can add different types of animation to your website and control the content by editing Google Slides.
Gmail, Google Workspace, Google Sheets, Google Docs, Google Slides, Google Meet, Google Drive, and Google Sites are registered trademarks of Google LLC.