There are many business uses for Google Gemini Pro Deep Research. A key use we discovered is for better informing B2B sales representatives about their target accounts.
Salespeople once had to spend hours upon hours getting to know their prospects before reaching out. Thanks to LLMs like Gemini, those days are gone.
With the right prompts, Gemini can output information in various formats tailored to different learning styles: readers, those who process information visually, and those who are more auditory.
Google Gemini is available to all users of Google Workspace.
To use Gemini, go to gemini.google.com and select ‘Pro’ in the top left or ‘Flash’ if your company uses Google Workspace Starter.
Gemini Research Report
In the prompt field, select ‘Tools’ and then select ‘Deep Research.’

Enter a prompt such as the following:
<task>
You are a world-class company researcher working for [Your Company (yourdomain.com)]. [Your Company] offers [What your company offers].</task>
<inputs>
<target_account_name>[Target Account Name]</target_account_name><target_account_domain>[Target Account Domain]</target_account_domain></inputs>
<instructions>
1. Create a report for the target account that covers the following:
– The key senior management team players and their approach to doing business
– Recent financial performance
– Market focus
– Business challenges
– The company’s [What You Care About – e.g., ‘Technology Stack’]
– Ideas on how to best navigate the organization from a selling perspective
2. Include ‘Last Updated: ‘The Current Month’ + ‘The Current Year’ in the top right corner.
</instructions>
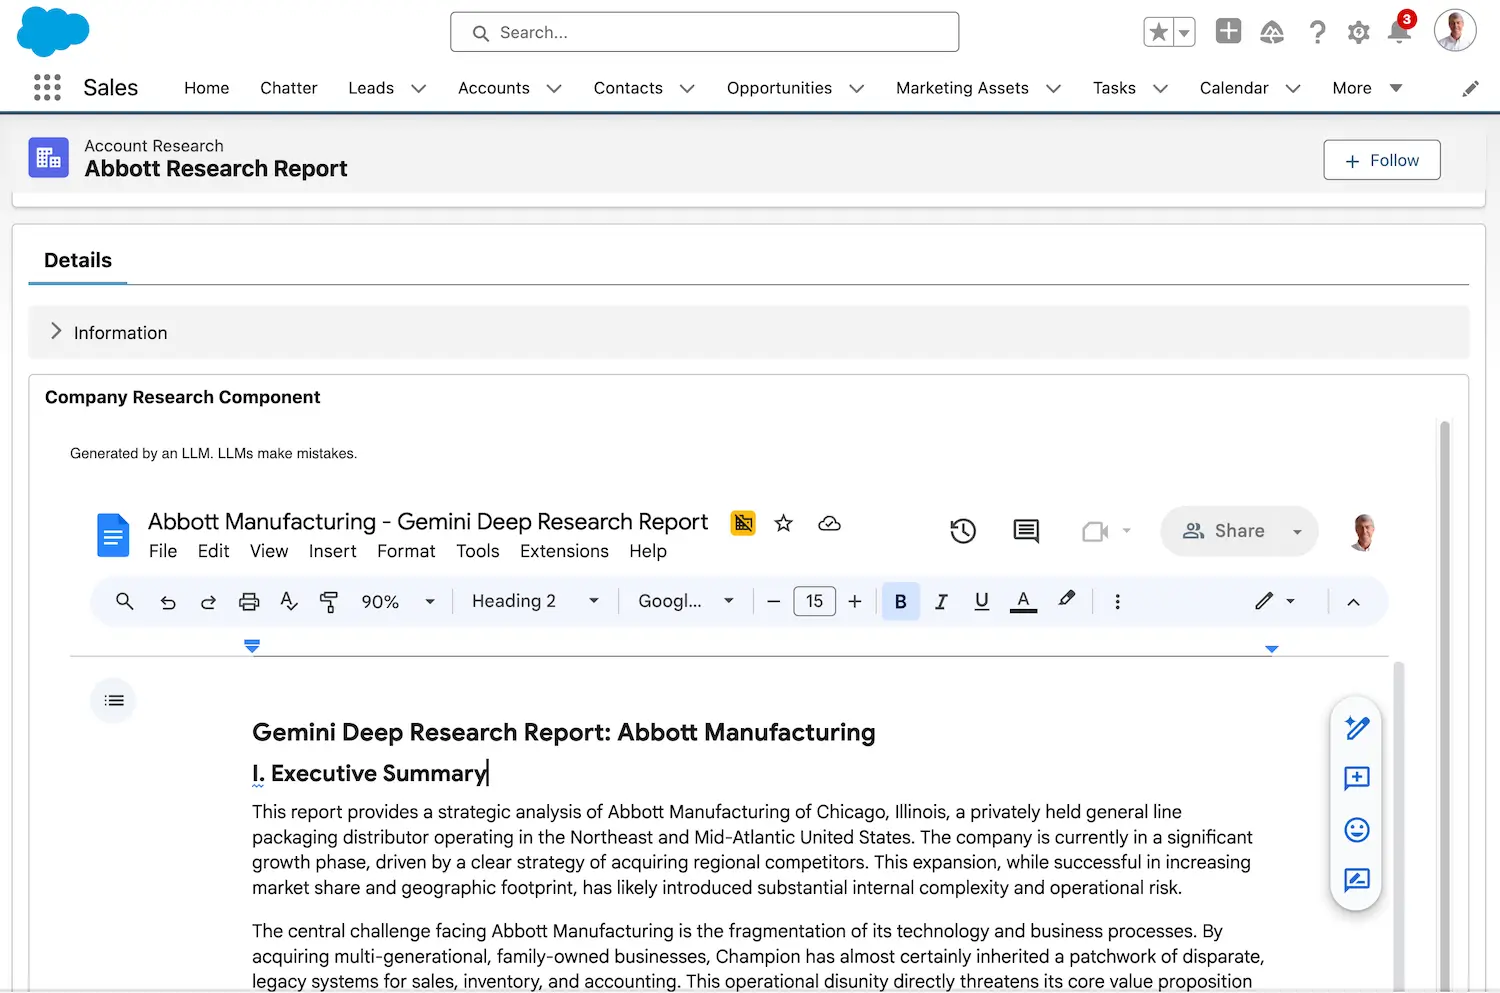
Once the output has been generated, you can save it as a Google Doc in a shared Google Drive folder.
From there, if you use a Google Drive-connected CRM system, such as Salesforce, you can embed the report in an Account record for easy access by the salesperson responsible for that account.
You can also use the Doc as a NotebookLM source, as part of additional target account analysis.
Company Research Dashboard
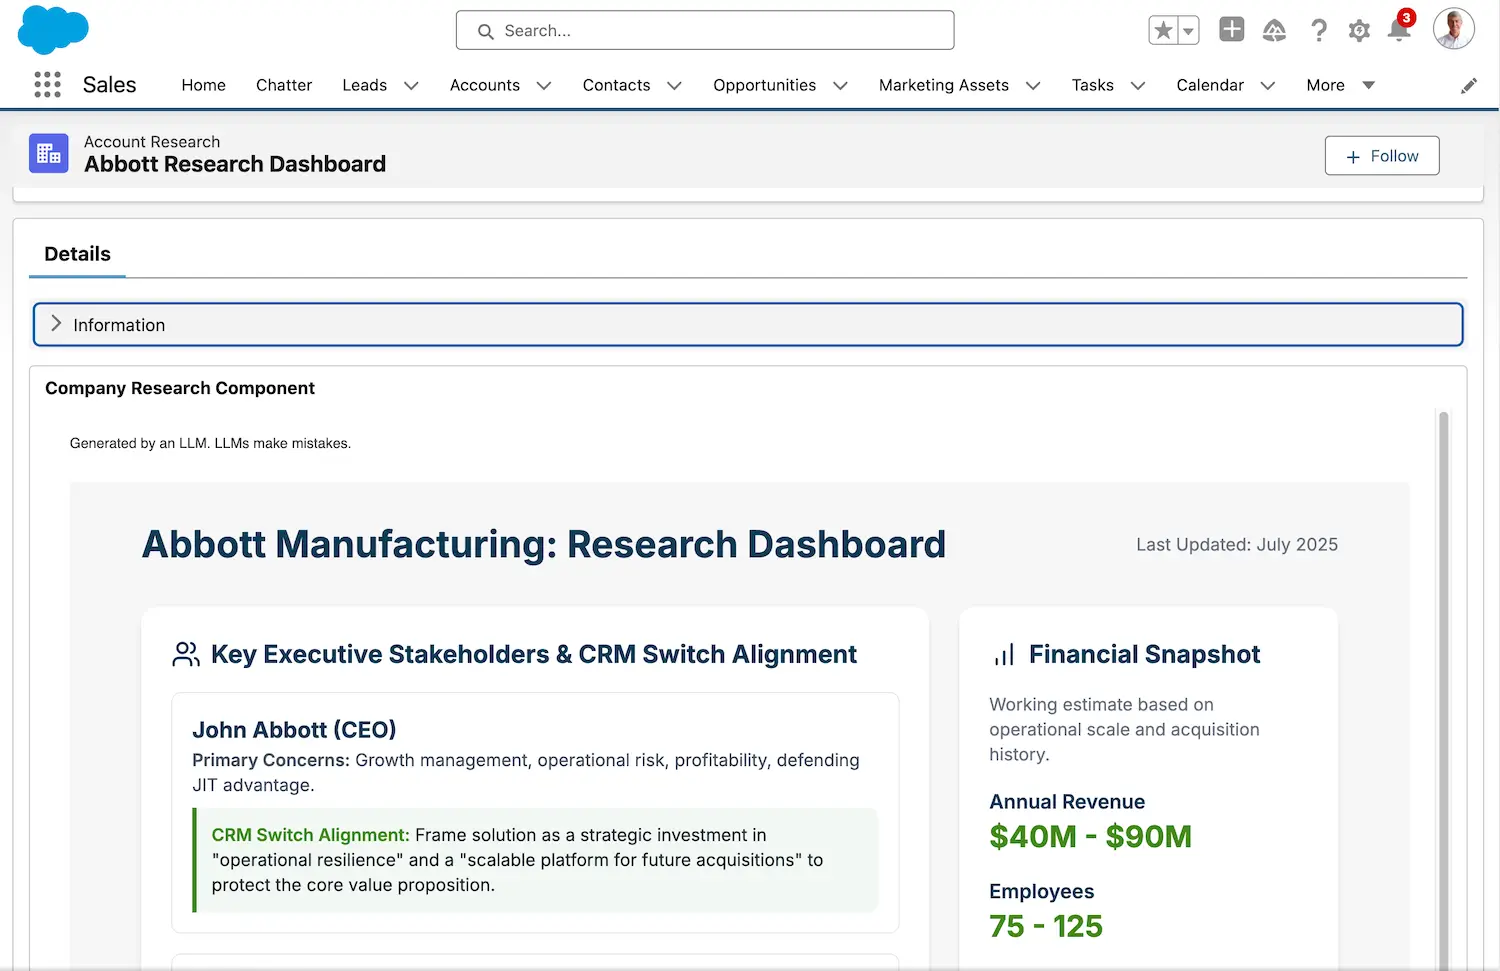
To take it one step further, you can prompt Gemini for a summary infographic of the long-form research report.
This format gives salespeople much more easily digestible content. It’s also better for visual learners.
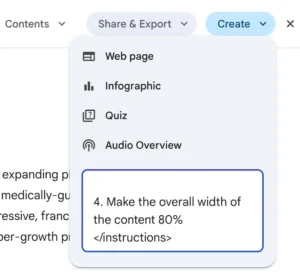
Paste the following prompt into the ‘Create > Describe your own app’ field. Don’t worry, it will all fit.
<task>
Create a light-themed dashboard for easy access to the most critical financial, executive, and operational information.
</task>
<instructions>
1. The heading
– Title the dashboard: ‘The Company Name’: + Research Dashboard
– Include: Last Updated: ‘The Current Month’ + ‘The Current Year’ in the top right corner.
2. Include the following sections in the following order:
– Key Executive Stakeholders & CRM Switch Alignment
– Financial Snapshot
– [What You Care About, e.g., The Technology Stack]
– Strategic Initiatives
– Business Challenges
– The [Your Company] Opportunity
3. Incorporate our brand colors:
– #[Your Brand Hex Color 1]
– #[Your Brand Hex Color 2]
– #[Your Brand Hex Color 3]
4. Make the overall width of the content 80%
</instructions>
The infographic is generated as HTML and can be copied and pasted into an HTML page for publication on various platforms.
You can also create an image or PDF screenshot using a Chrome Web Store extension called FireShot.
The Canvas infographic can be associated with a Salesforce Account record.
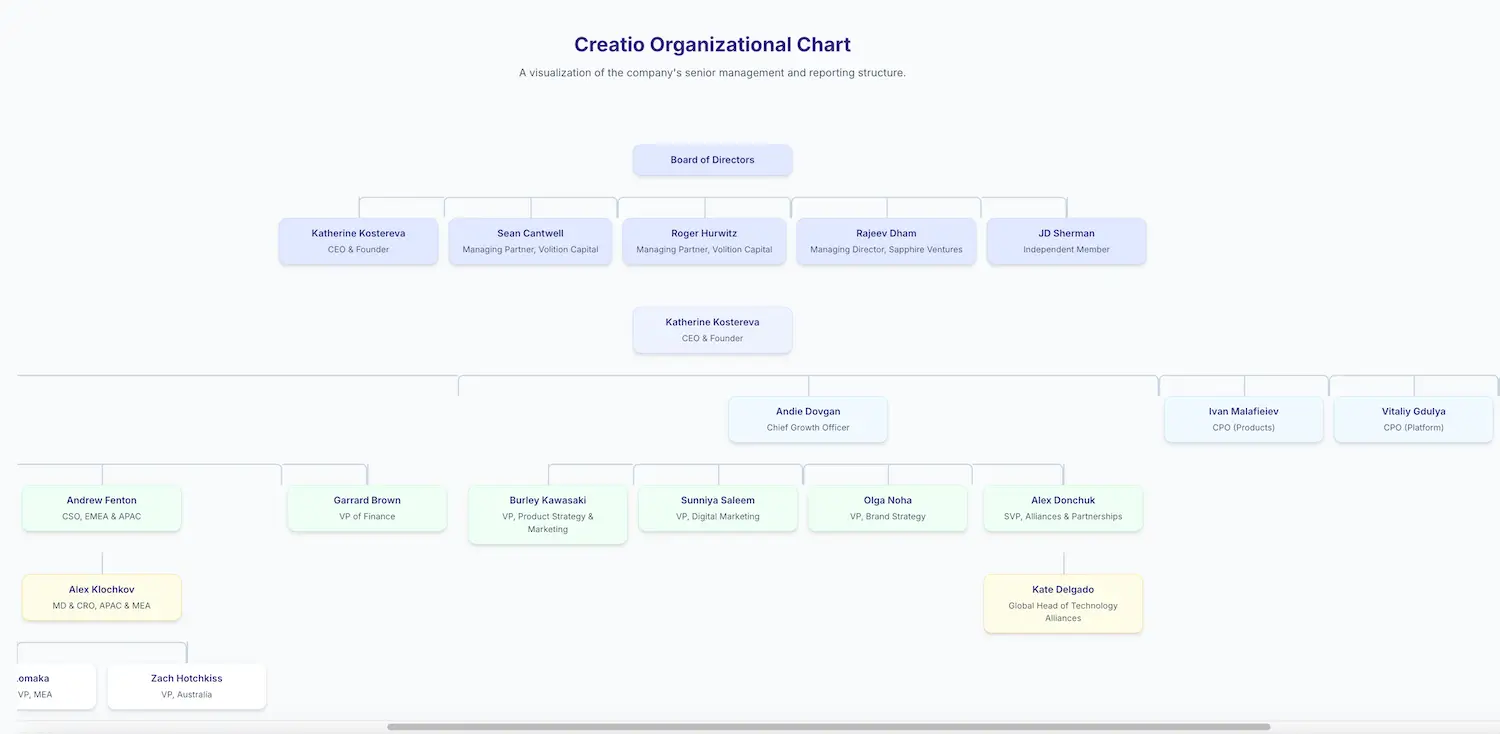
You can try other visual representations, such as org charts, using the Canvas option in Gemini.
Deep Research Audio
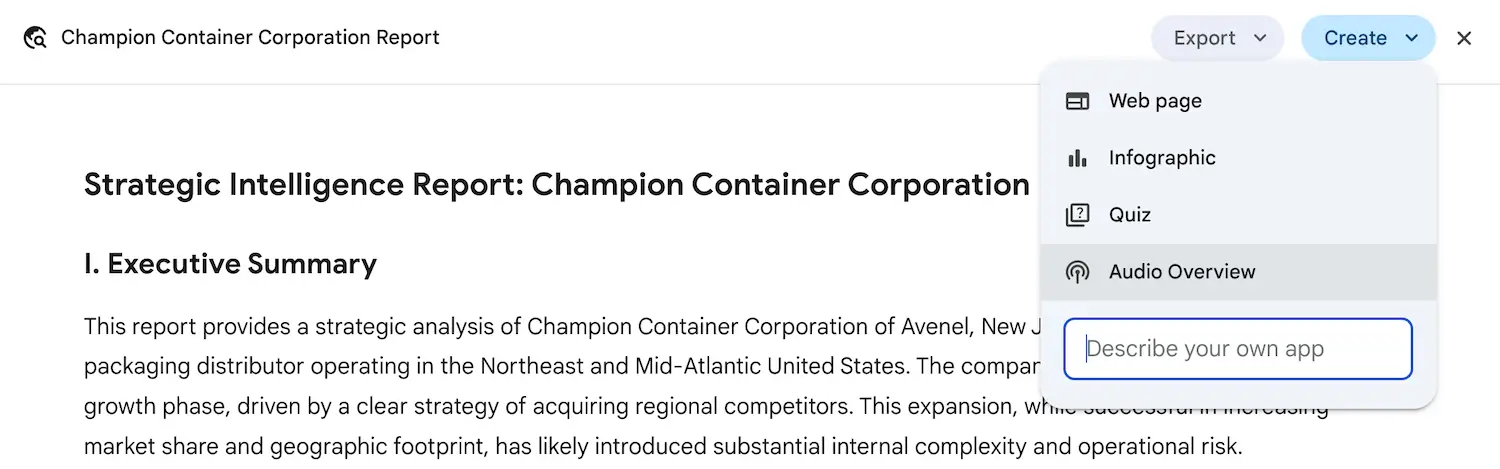
For salespeople who are auditory learners, access to an Audio Overview of Gemini’s deep company research can be invaluable.
To generate a conversational podcast-style version of a research report, select ‘Create’ and then ‘Audio Overview.’
The MP3 file can be saved to Google Drive or uploaded to a CRM system, such as Salesforce, for playback.
Here’s one we asked Gemini to create for Yeti.
Create a [Rough] Org Chart
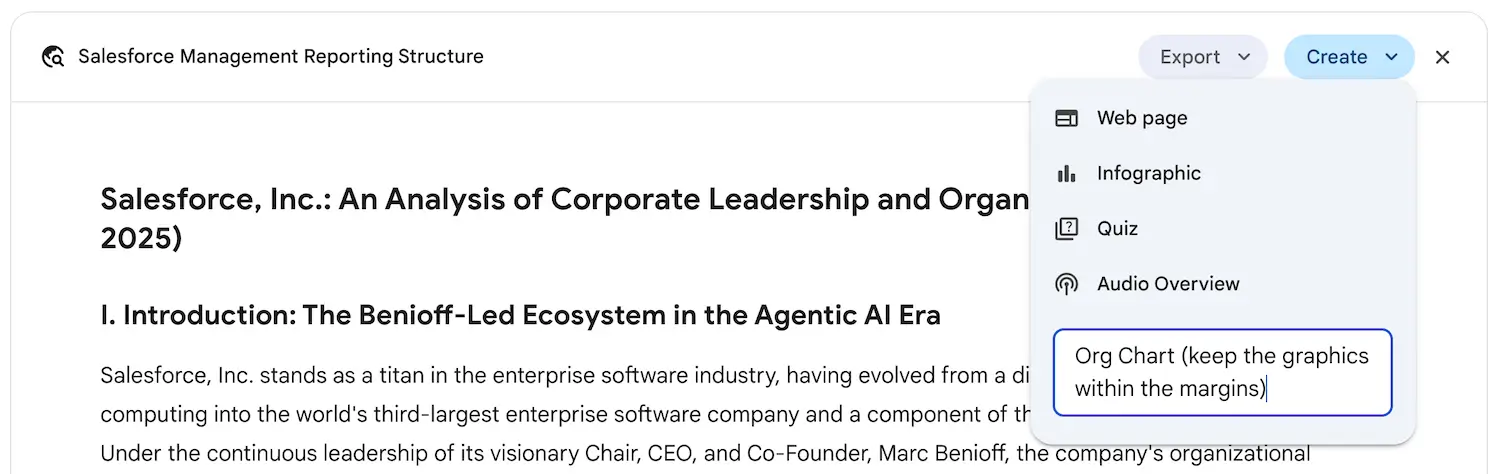
You can prompt Gemini for deep research on a company, with an org chart as the goal. The prompt we used was:
Please report on management personnel for Salesforce, including their reporting structure. I plan to use this information to request a Canvas org chart from you.
After the report was generated, we selected ‘Create’ and then typed ‘Org Chart’ in the ‘Describe your own app’ box. The ‘(keep the graphics within the margins)’ was added because previous generations were cut off at the margins.
This could serve as a starting point for designing a more accurate organizational chart in an app like Lucidchart. The Gemini org chart structure can be exported to a CSV and imported into Lucidchart.
On several fronts, AI has become the most important sales enablement tool in a salesperson’s quiver.
By giving your sales team access to Gemini’s deep research in various formats, you can help them close more deals, more quickly.